 Fraunhofer Institute for Wind Energy Systems
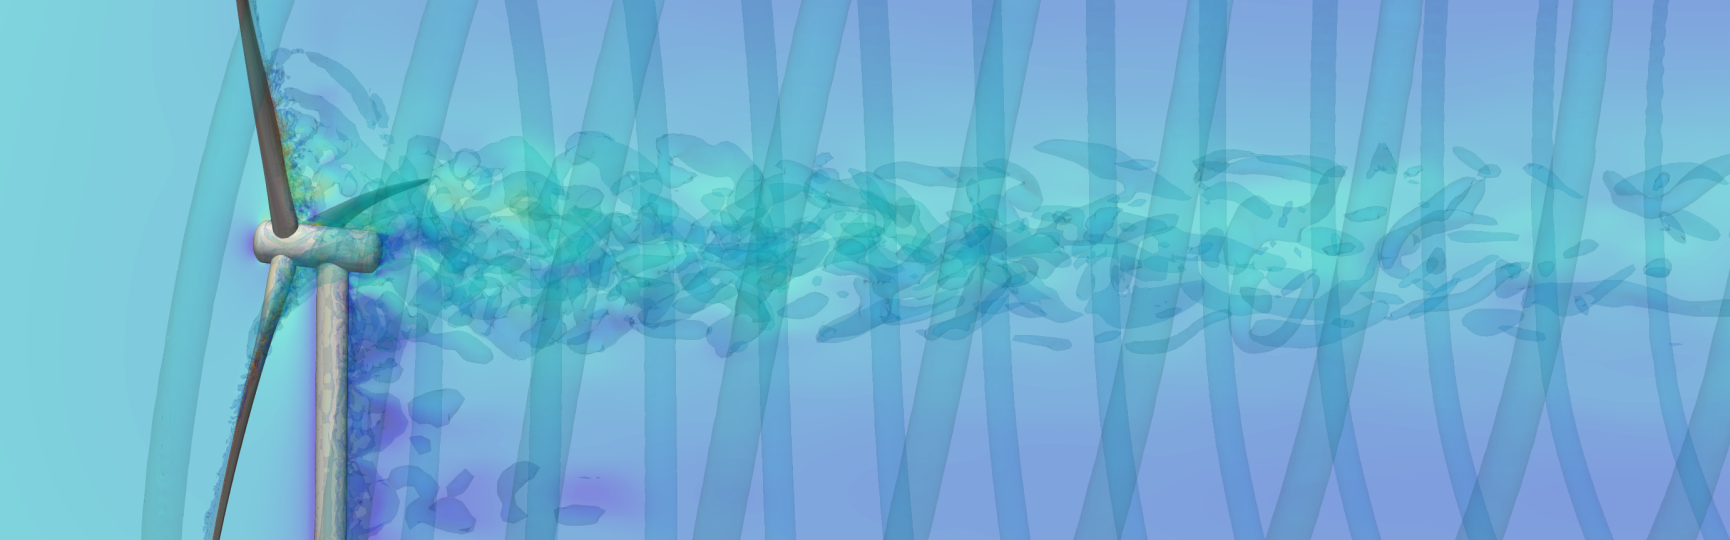
IWES uses mesoscale simulations to generate precise time series data for researching the influence of meteorological conditions on wind farms.
Modeling of meteorological influences on wind turbines as well as of wake and wind flow effects
Wind energy meteorology and numerical site assessment
Modeling of wake effects in wind farms and wind farm clusters
Our services in numerical wind field modeling and aerodynamics
Comprehensive modeling is crucial for the reliable analysis of wind sites. Fraunhofer IWES utilizes mesoscale simulations to generate precise time series data for large areas – data which can subsequently be employed to investigate research questions regarding the influence of meteorological conditions on wind farms. Topographical factors such as soil conditions, land use, and forest cover can be represented in 3D meshes with typical resolutions of between 1 and 100 meters. Computational fluid dynamics (CFD) is used to solve the wind and turbulence fields for each wind direction sector in order to determine the wind potential. Further focuses in the IWES portfolio: Modeling of wake effects in wind farms, aerodynamic simulation of wind turbines, fluid-structure interaction (FSI) and aeroacoustics.

Atmospheric conditions play a key role in electricity production in wind farms. Passing weather systems and local effects determine the wind, air density, and temperature fields and influence the turbulence conditions in which wind farms operate. These meteorological conditions are decisively responsible for the yield generated by wind farms, and their comprehensive modeling is crucial for the reliable analysis of wind sites. Fraunhofer IWES utilizes mesoscale simulations for this purpose, which generate corresponding time series data for large areas with edge lengths of hundreds of kilometers and resolutions in the subkilometer range with considerable computational effort. The data collected can subsequently be employed to investigate a wide range of research questions regarding the influence of meteorological conditions on wind farms.
In the onshore wind energy sector, the effects of topographical factors, soil conditions, and land use, for example forest cover, are crucial. These details can be represented in 3D meshes with typical resolutions of between 1 and 100 meters. CFD is then used to solve the wind and turbulence fields for each wind direction sector in order to determine the wind potential. In this way, it is possible to investigate the local influences of forests, complex terrain, thermal stratification, and many more factors on wind farm yields at the site.

Wind turbines in wind farms influence each other via what is known as the wake effect, where downstream turbines display power losses resulting from the zones of decreased wind speeds and increased turbulence developing behind the rotor of an operating wind turbine.
Utilizing CFD, IWES investigates the physics of these wakes, their development, extent, and dependencies on meteorological conditions and local factors – from individual wakes to wind farm cluster wakes with lengths of more than 100 km.
IWES employs and researches rapid wake models using the open-source software FOXES, developed at the institute, to calculate the influence of the wake effect on wind farm yields over several decades. When doing so, the research objective is to use simple models to achieve as realistic as possible a representation of the actual wake in the wind farm and reproduce the reaction of the wind turbines with accuracy.
These rapid wake models are ideal for use in wind farm optimization. In addition to the determination of the optimal installation sites for the turbines within a set wind farm area, the focus is also on the optimization of control parameters such as the controlled curtailment of individual wind turbines to increase the overall farm yield or the intentional yawing of rotors to deflect wakes

Every wind flow generates forces on the rotor blades of wind turbines, forces which depend directly on the blade geometry and other local conditions. For our CFD simulation of entire wind turbines, IWES creates detailed 3D meshes with the finest resolutions in the hundredths of a millimeter range, roughly equivalent to the thickness of a human hair. IWES simulates the dynamic development of the forces and the turbulent wind flow, with a time step of a few milliseconds in some cases.
Utilizing these high-resolution simulation results, IWES investigates the forces driving the rotor on the one hand and the formation and dynamics of the vortices combining to form the wake of the wind turbine on the other. The vortices are predominantly shed at the rapidly rotating blade tips and travel along rotating spirals until they interact with each other, and other vortices generated for the most part at the huband on the tower, merge, and, ultimately, dissipate.
Precise understanding of these processes is just as important for the design of future rotor blade geometries as it is for the development of wake models. In addition, IWES analyzes special configurations and designs of blades, turbines, and towers along with their aerodynamic characteristics and the influence of the turbulence of the incoming wind.

The rotor diameters of modern wind turbines have long since passed the 150-meter mark and continue to increase in size with every new generation. This results in ever-greater forces pulling on the rotating blades in all directions. The flexible fiber-reinforced plastic (FRP) material from which the blades are produced yields under these forces and deforms. This deformation affects the aerodynamic characteristics and vibration behavior of the wind turbine and thus also the electrical power generated by the turbine, the loading of the turbine, and the development of its wake.
IWES uses high-resolution CFD to study the flow effects of the flexible blades as they deform during rotation. A fluid-structure interaction module for the open source CFD software OpenFOAM was developed and implemented at IWES so as to allow modeling of the dynamic interaction of the flexible material with the wind field.
As the size of wind turbines increases and the use of wind energy expands, the topic of aeroacoustics is also becoming increasingly important, and with it the question of the causes of noise pollution from wind turbines. On the basis of the vortex-resolving flow simulation results, IWES applies the physics of sound propagation to investigate the sources and dynamics of noise development. This research contributes to designing and constructing wind turbines producing as little noise as possible in the future.